Elevation data of the Luxemburg provided along with the terra package will be used for this exercise.
We will use the data over Luxembourg from terra package for this exercise. terra package provides the elevation raster of Luxembourg and commune boundary for Luxembourg. Let’s read that data first.
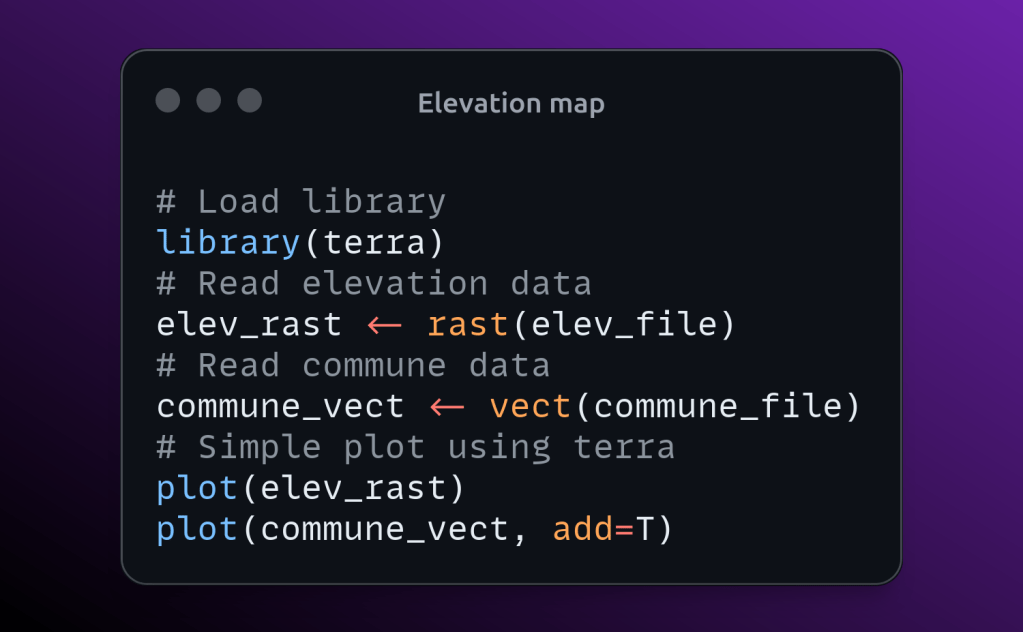
# Load library
library(terra)
# Read elevation data
elev_file <- system.file("ex/elev.tif", package="terra")
elev_rast <- rast(elev_file)
# Read commune data
commune_file <- system.file("ex/lux.shp", package="terra")
commune_vect <- vect(commune_file)
Simply plot the elevation data and over vector file on top of that using the following code.
# Simple plot using terra
plot(elev_rast)
plot(commune_vect, add=T)
We can customize the title, color scale, legend range, legend position, north arrow, labels etc, in the plot. Check the following block of code for the same and save it as png.
# Terra plot adding title and customize styles
cols <- colorRampPalette(c('#2b83ba', '#91cba8', '#ddf1b4',
                           '#fedf99', '#f59053', '#761002'))(255)
# Plot raster and save it as png
png('elevation.png', res=300, width=1920, height=1080)
plot(elev_rast, col=cols, range = c(100, 600), main = 'Luxembourg elevation',
     type='continuous', legend='right', buffer=T)
# Add polygon on top of raster
plot(commune_vect, add=T)
# Add north arrow
north("topright")
# Add labels
text(commune_vect, commune_vect$NAME_2,
     col=c("black"), halo=T,
     vfont=c("sans serif", "bold"), cex=0.75)
dev.off()
The entire code is given below. Feel free to use it and give your comments.
# Load library
library(terra)
# Read elevation data
elev_file <- system.file("ex/elev.tif", package="terra")
elev_rast <- rast(elev_file)
# Read commune data
commune_file <- system.file("ex/lux.shp", package="terra")
commune_vect <- vect(commune_file)
# Simple plot using terra
plot(elev_rast)
plot(commune_vect, add=T)
# Terra plot adding title and customize styles
cols <- colorRampPalette(c('#2b83ba', '#91cba8', '#ddf1b4',
                           '#fedf99', '#f59053', '#761002'))(255)
# Plot raster and save it as png
png('elevation.png', res=300, width=1920, height=1080)
plot(elev_rast, col=cols, range = c(100, 600), main = 'Luxembourg elevation',
     type='continuous', legend='right', buffer=T)
# Add polygon on top of raster
plot(commune_vect, add=T)
# Add north arrow
north("topright")
# Add labels
text(commune_vect, commune_vect$NAME_2,
     col=c("black"), halo=T,
     vfont=c("sans serif", "bold"), cex=0.75)
dev.off()

Leave a comment