Have you ever worked on extracting statics such mean, median, etc over raster for the each polygon feature of a vector file ? If you have done the same using desktop GIS application such as QGIS or ArcGIS or similar software, it will be very time consuming to do multiple files. In this article I will explain how to do the same over 100s of raster file using R.
Read raster and vector
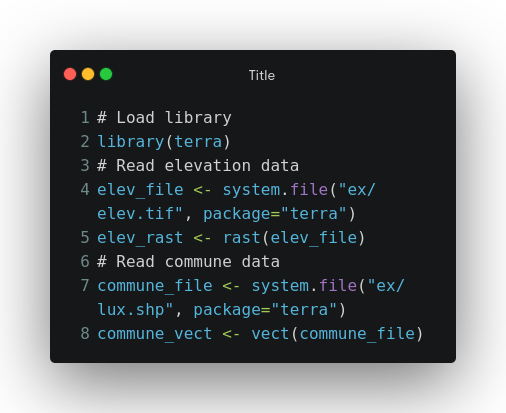
We will use the data over Luxembourg from terra package for this exercise. terra package provides the elevation raster of Luxembourg and commune boundary for Luxembourg. Let’s read that data first.
# Load library
library(terra)
# Read elevation data
elev_file <- system.file("ex/elev.tif", package="terra")
elev_rast <- rast(elev_file)
# Read commune data
commune_file <- system.file("ex/lux.shp", package="terra")
commune_vect <- vect(commune_file)
Extract raster data
Now let’s find the mean value of elevation over commune polygon using below code
# Zonal statistics - mean
mean_elev <- zonal(elev_rast, commune_vect, fun='mean')
print(mean_elev)
You might have noticed that few communes have NaN values, this is because few pixels inside that commune have NA value, while doing mean or any statistics we have to remove those pixels. To do that check the following code block.
# Zonal statistics - mean
mean_elev <- zonal(elev_rast, commune_vect, fun='mean', na.rm=T)
print(mean_elev)
Similarly we can do the other statistics such as median, minimum, maximum, etc
# Zonal statistics - median
median_elev <- zonal(elev_rast, commune_vect, fun='median', na.rm=T)
print(head(median_elev))
# Zonal statistics - minimum
minimum_elev <- zonal(elev_rast, commune_vect, fun='min', na.rm=T)
print(head(minimum_elev))
# Zonal statistics - maximum
maximum_elev <- zonal(elev_rast, commune_vect, fun='max', na.rm=T)
print(head(maximum_elev))
# Zonal statistics - sum
sum_elev <- zonal(elev_rast, commune_vect, fun='sum', na.rm=T)
print(head(sum_elev))
# Zonal statistics - standard deviation
sd_elev <- zonal(elev_rast, commune_vect, fun='sd', na.rm=T)
print(head(sd_elev))
Now let’s combine all the different statistics into a single data frame, with district and commune names. Also save the zonal statistics as a Comma-separated values (CSV) file.
stats_df <- data.frame(district = commune_vect$NAME_1,
                       commune=commune_vect$NAME_2,
                       minimum = minimum_elev[,1],
                       mean = mean_elev[,1],
                       median = median_elev[,1],
                       maximum = maximum_elev[,1],
                       sum = sum_elev[,1],
                       standard_deviation = sd_elev[,1])
print(stats_df)
# Save the data frame as CSV file
write.csv(stats_df, 'Luxembourg_elevation_zonal_stats.csv', row.names=F)
Entire code is given below
# Load library
library(terra)
# Read elevation data
elev_file <- system.file("ex/elev.tif", package="terra")
elev_rast <- rast(elev_file)
# Read commune data
commune_file <- system.file("ex/lux.shp", package="terra")
commune_vect <- vect(commune_file)

# Zonal statistics - mean
mean_elev <- zonal(elev_rast, commune_vect, fun='mean')
print(mean_elev)

# Zonal statistics - mean
mean_elev <- zonal(elev_rast, commune_vect, fun='mean', na.rm=T)
print(mean_elev)

# Zonal statistics - median
median_elev <- zonal(elev_rast, commune_vect, fun='median', na.rm=T)
print(head(median_elev))
# Zonal statistics - minimum
minimum_elev <- zonal(elev_rast, commune_vect, fun='min', na.rm=T)
print(head(minimum_elev))
# Zonal statistics - maximum
maximum_elev <- zonal(elev_rast, commune_vect, fun='max', na.rm=T)
print(head(maximum_elev))
# Zonal statistics - sum
sum_elev <- zonal(elev_rast, commune_vect, fun='sum', na.rm=T)
print(head(sum_elev))
# Zonal statistics - standard deviation
sd_elev <- zonal(elev_rast, commune_vect, fun='sd', na.rm=T)
print(head(sd_elev))
# Combine different statistics into a dataframe
stats_df <- data.frame(district = commune_vect$NAME_1,
                       commune=commune_vect$NAME_2,
                       minimum = minimum_elev[,1],
                       mean = mean_elev[,1],
                       median = median_elev[,1],
                       maximum = maximum_elev[,1],
                       sum = sum_elev[,1],
                       standard_deviation = sd_elev[,1])
print(stats_df)
# Save the data frame as CSV file
write.csv(stats_df, 'Luxembourg_elevation_zonal_stats.csv', row.names=F)
In this exercise, I have used only the predefined functions, but if one wants they can pass their own functions. Also one can use extract() as an alternate to extract values from raster and summarize that. Also please let me know, what method you uses to do that ? why that is better ?
Any feedback/suggestions for future blogs are most welcome.

Leave a comment